System status
How to check whether PrintPort3D is operating normally, and how to read the status page accurately.
5 min read
When orders, Studio, or shipping seem stuck, the public status page at /status answers whether the problem is on the platform or on your side. This page explains where to find it, how to interpret each indicator, and one caveat that keeps you from over-trusting a green board.
Finding the status page
PrintPort3D publishes a live health page at /status. It is fully public: no login, Workspace, or seller account is required, so you, a teammate, or a customer can open it from any device. It does not appear in the Workspace sidebar. It is linked from the footer of the public site alongside Docs, Compare, Terms, Privacy, and Contact, and you can bookmark it directly.
/status. Public, auto-refreshing, and safe to share.TroubleshootingFirst-stop fixes for the most common problems.Shareable by link, excluded from search
The overall status banner
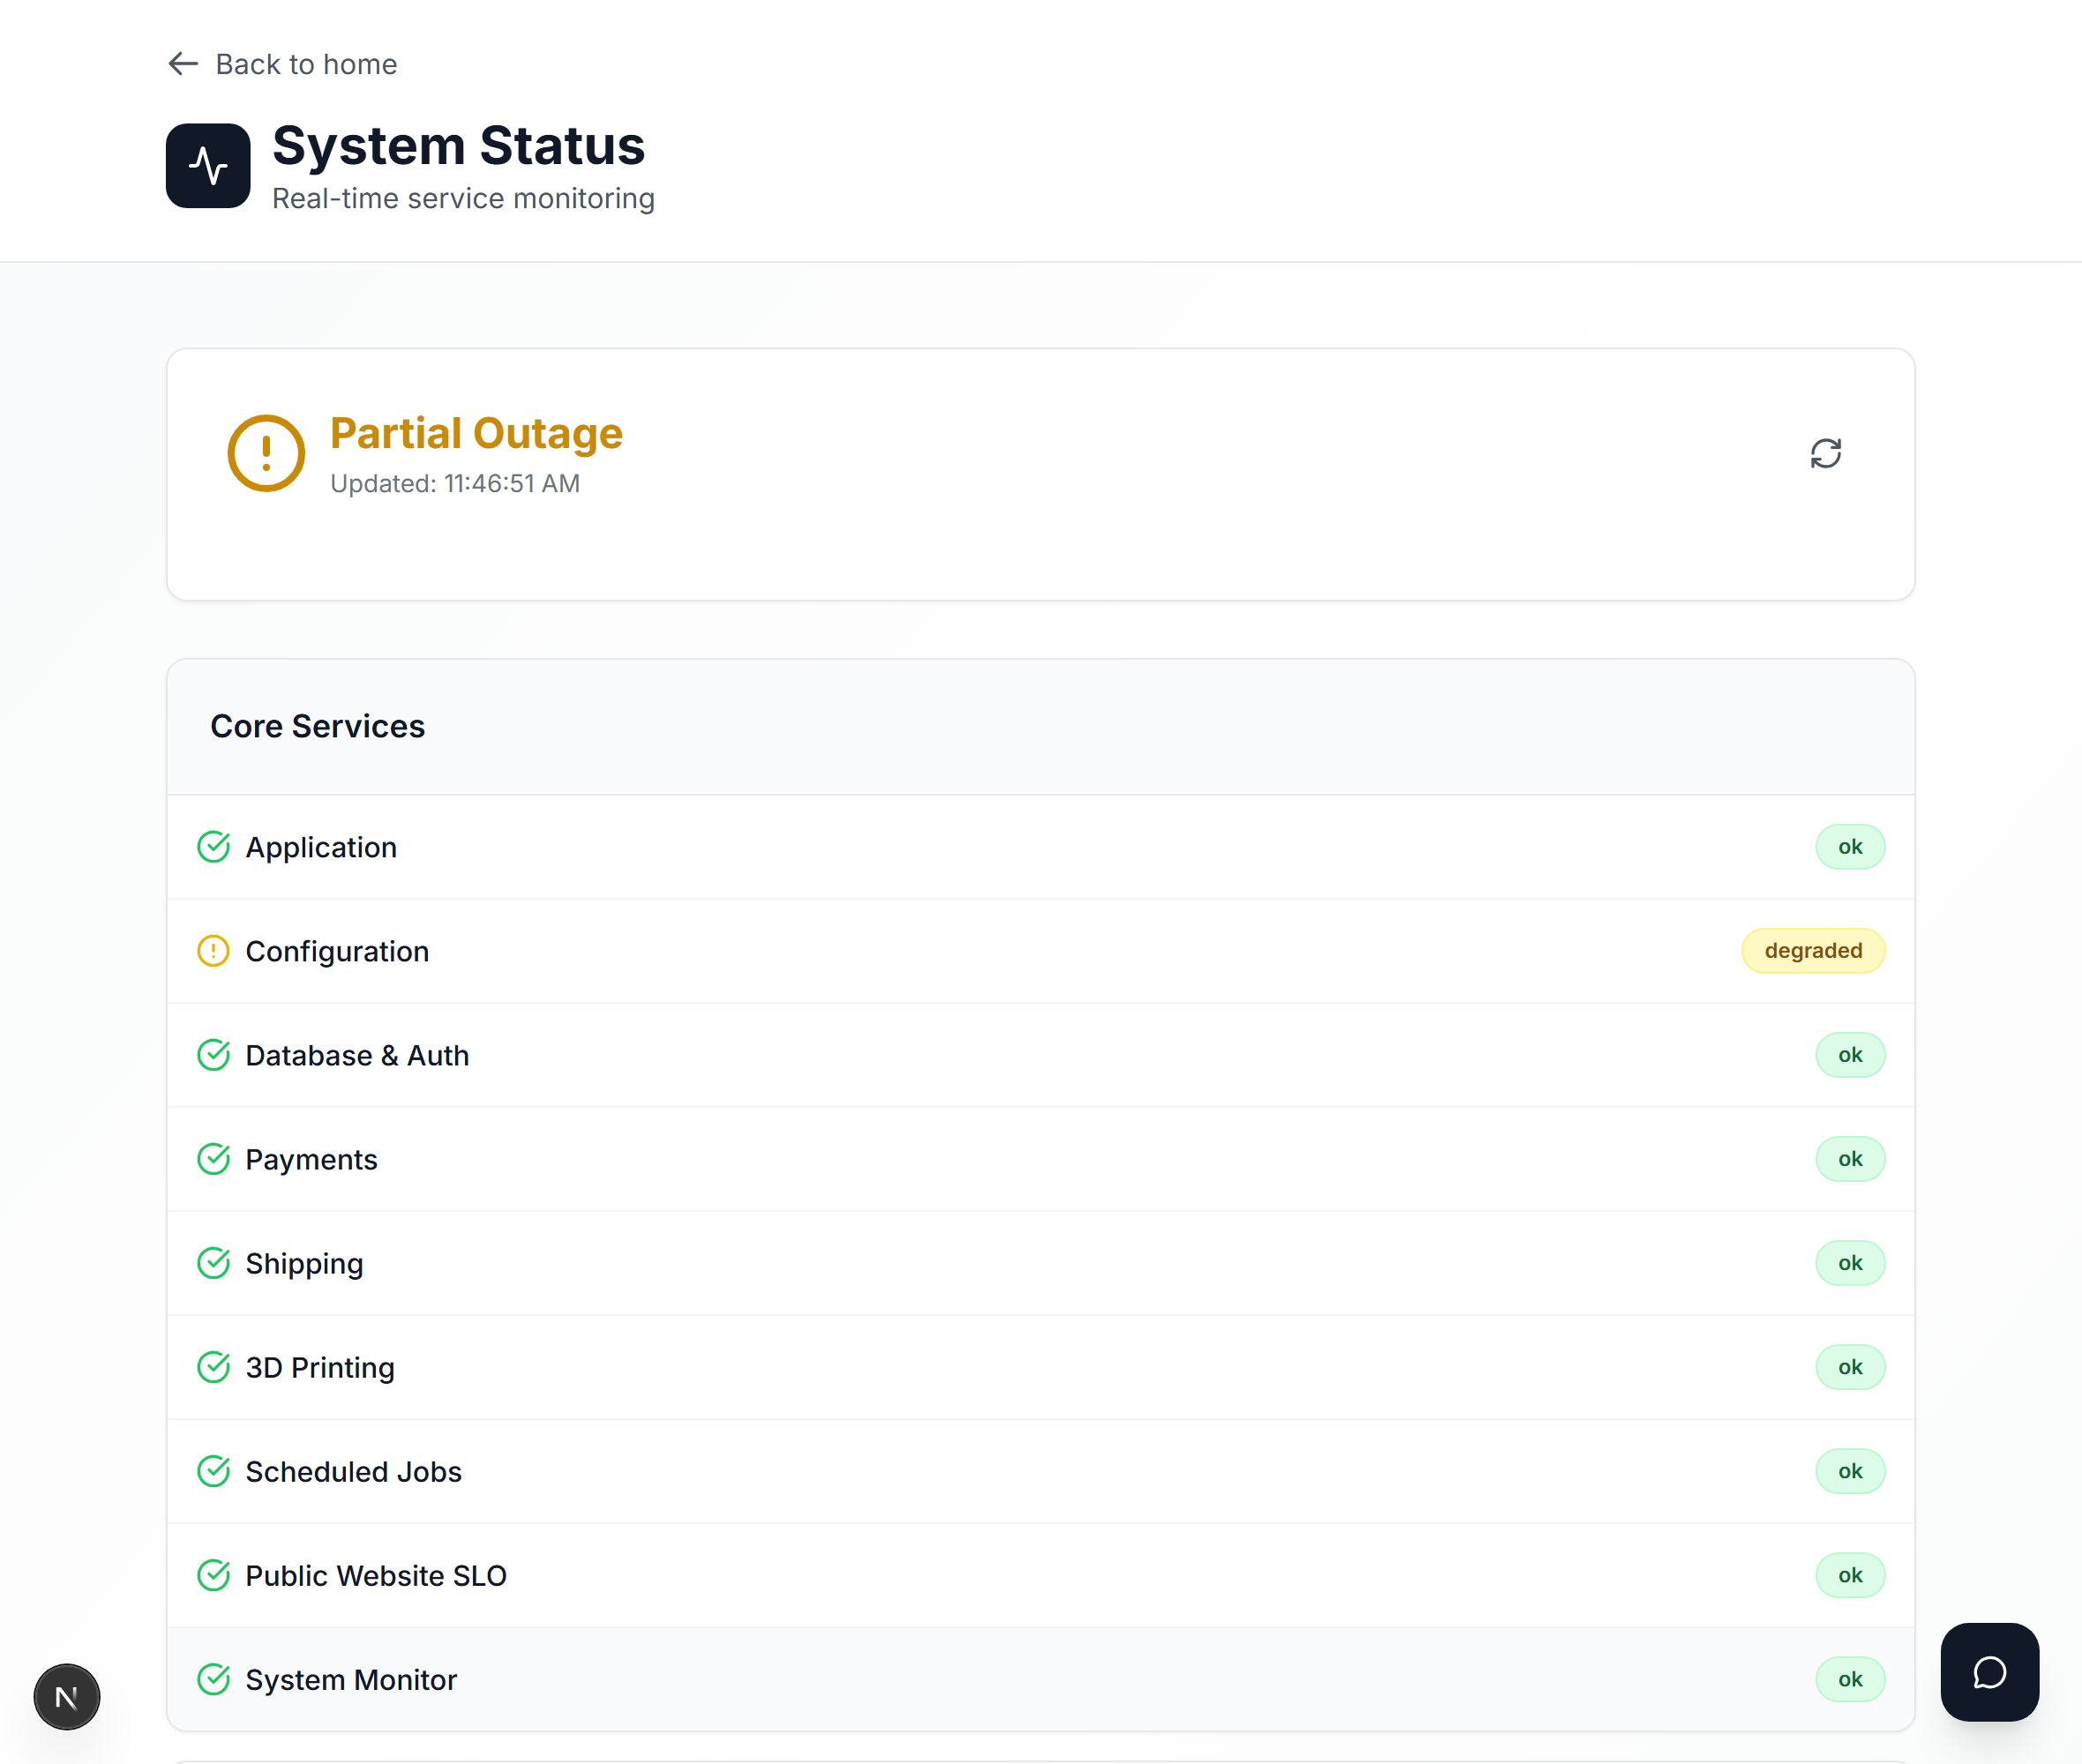
The top of the page shows a single verdict computed from all of the service checks below it. The banner is the fastest read on the page: its color tells you the overall state at a glance.
The three states of the overall banner
| Banner | Color | Meaning |
|---|---|---|
| All Systems Operational | Green | Every check is passing. Nothing is flagged. |
| Partial Outage | Yellow | Something is degraded, missing, or unknown, but nothing is hard-down. |
| System Issues | Red | At least one service has an active, unresolved problem. |
- All Systems OperationalColorGreenMeaningEvery check is passing. Nothing is flagged.
- Partial OutageColorYellowMeaningSomething is degraded, missing, or unknown, but nothing is hard-down.
- System IssuesColorRedMeaningAt least one service has an active, unresolved problem.
Two brief in-between states also appear. On first load, the banner reads Checking… for a moment while it initializes. If your device cannot reach the page at all, you will see a red Unable to Load Status card with a Retry button. That reflects your connection to the page, not the state of the platform.
The page refreshes automatically
What each service reports
Below the banner is a list of Core Services, each with a colored dot and a one-word badge. Green indicates the service looks healthy, yellow indicates degraded or unconfirmed, and red indicates an active problem. The table below maps each row to the part of PrintPort3D it covers.
Each Core Service and what it covers
| Row on the page | What it monitors | A red dot here means |
|---|---|---|
| Application | The core PrintPort3D app responding at all. | The site itself is struggling. |
| Database & Auth | Signing in, and reading or saving your data. | You cannot log in, or your Workspace will not load. |
| Payments | The card charges that pay to make your orders, plus custom-order checkout. | New charges may fail to go through. |
| Shipping | Buying labels and reading tracking through Shippo. | Labels or tracking updates stall. |
| 3D Printing | The print farm that produces your orders. | Production may be delayed. |
| Scheduled Jobs | The background automation that advances orders and refreshes your pages. | Updates run slower than usual. |
| System Monitor | The health checker that writes this page’s data. | The board itself may be behind. |
| Public Website SLO | The speed and availability of the public marketing site. | Public pages are slow or unreliable. |
| Configuration | The server has all of its required settings in place. | The deployment is misconfigured. |
- ApplicationWhat it monitorsThe core PrintPort3D app responding at all.A red dot here meansThe site itself is struggling.
- Database & AuthWhat it monitorsSigning in, and reading or saving your data.A red dot here meansYou cannot log in, or your Workspace will not load.
- PaymentsWhat it monitorsThe card charges that pay to make your orders, plus custom-order checkout.A red dot here meansNew charges may fail to go through.
- ShippingWhat it monitorsBuying labels and reading tracking through Shippo.A red dot here meansLabels or tracking updates stall.
- 3D PrintingWhat it monitorsThe print farm that produces your orders.A red dot here meansProduction may be delayed.
- Scheduled JobsWhat it monitorsThe background automation that advances orders and refreshes your pages.A red dot here meansUpdates run slower than usual.
- System MonitorWhat it monitorsThe health checker that writes this page’s data.A red dot here meansThe board itself may be behind.
- Public Website SLOWhat it monitorsThe speed and availability of the public marketing site.A red dot here meansPublic pages are slow or unreliable.
- ConfigurationWhat it monitorsThe server has all of its required settings in place.A red dot here meansThe deployment is misconfigured.
Runtime Environment mirrors Configuration
How current the data is
This is the most important detail to understand. Most service dots are not a fresh probe run the instant you open the page. The Database & Auth, Payments, Shipping, 3D Printing, and Public Website SLO dots show the last state a background health check recorded, and that check runs on a roughly 15-minute cadence. A dot can therefore be up to about 15 minutes stale.
A new issue can lag the board
A few indicators are computed live, at the moment you load the page: Application, Configuration and Runtime Environment, and the freshness of Scheduled Jobs and System Monitor. One related behavior is worth knowing. Immediately after a new deploy, the background checks may not have run yet, so the monitored dots can default to green even when something is wrong. The signal in that case is that Scheduled Jobs and System Monitor turn degraded, which tips the banner to yellow Partial Outage.
Badges display raw status words
When to check the status page
Check the status page before assuming a problem is your account, your store, or your data. It is the fast triage step that tells you which side of the platform boundary the issue is on.
- 1
Notice something is off
An order will not charge, Studio will not generate, a label will not buy, or the Workspace feels stuck. - 2
Open /status
Use the public site footer or your bookmark. Read the banner and the specific dot for the feature you are using: Payments for a charge, Shipping for a label, or 3D Printing for production. - 3
If it is green, the problem is likely on your side
When the platform looks healthy, the issue is more likely in your own setup or data: a declined card, an unmatched SKU, or a bad address. Go to Troubleshooting or Fix order problems. - 4
If it is red, the problem is platform-side
Give it a little time and check back, since the page re-checks every 60 seconds. If it stays red or you need help, use the Contact Support link in the page footer, which opens the public contact form, or reach us through Getting support.
Account for the 15-minute lag